Use cases
Built for the questions your data can already answer.
Glimpse BI reads the tables your plugins already write — store orders, memberships, courses, bookings, and more. Here’s what that looks like in practice.
Real dashboards
Two verticals, built on real data.
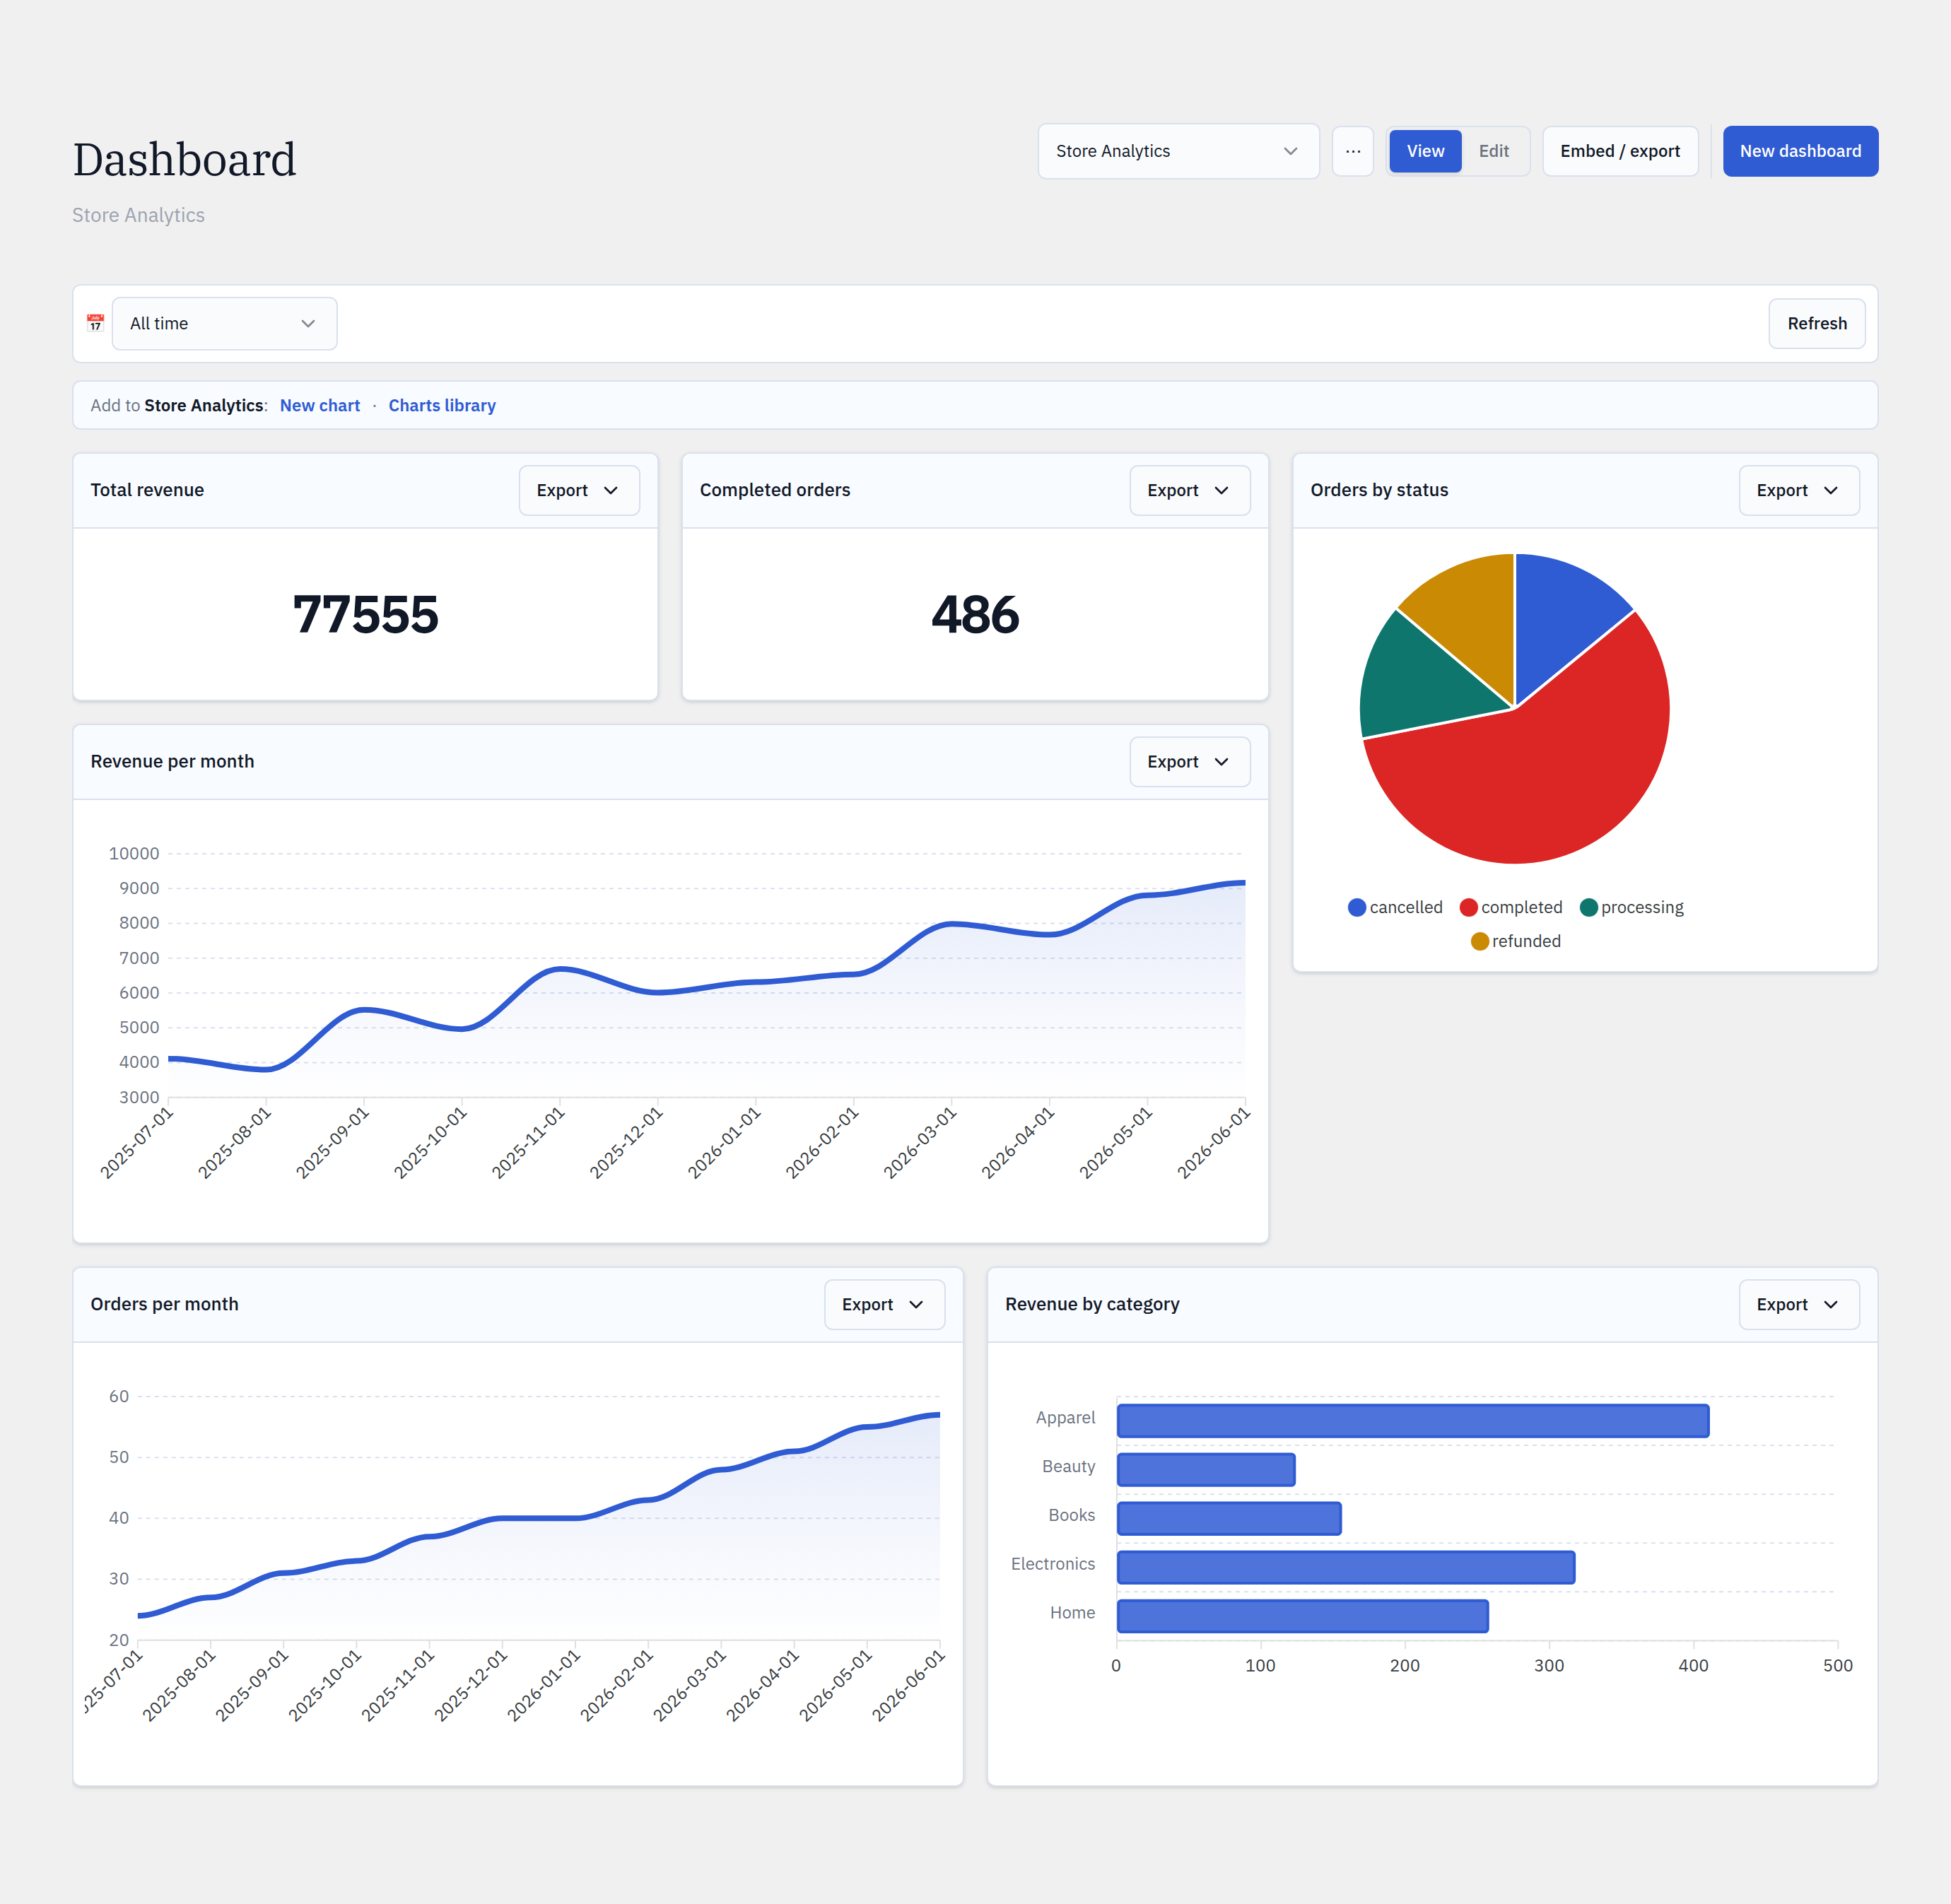
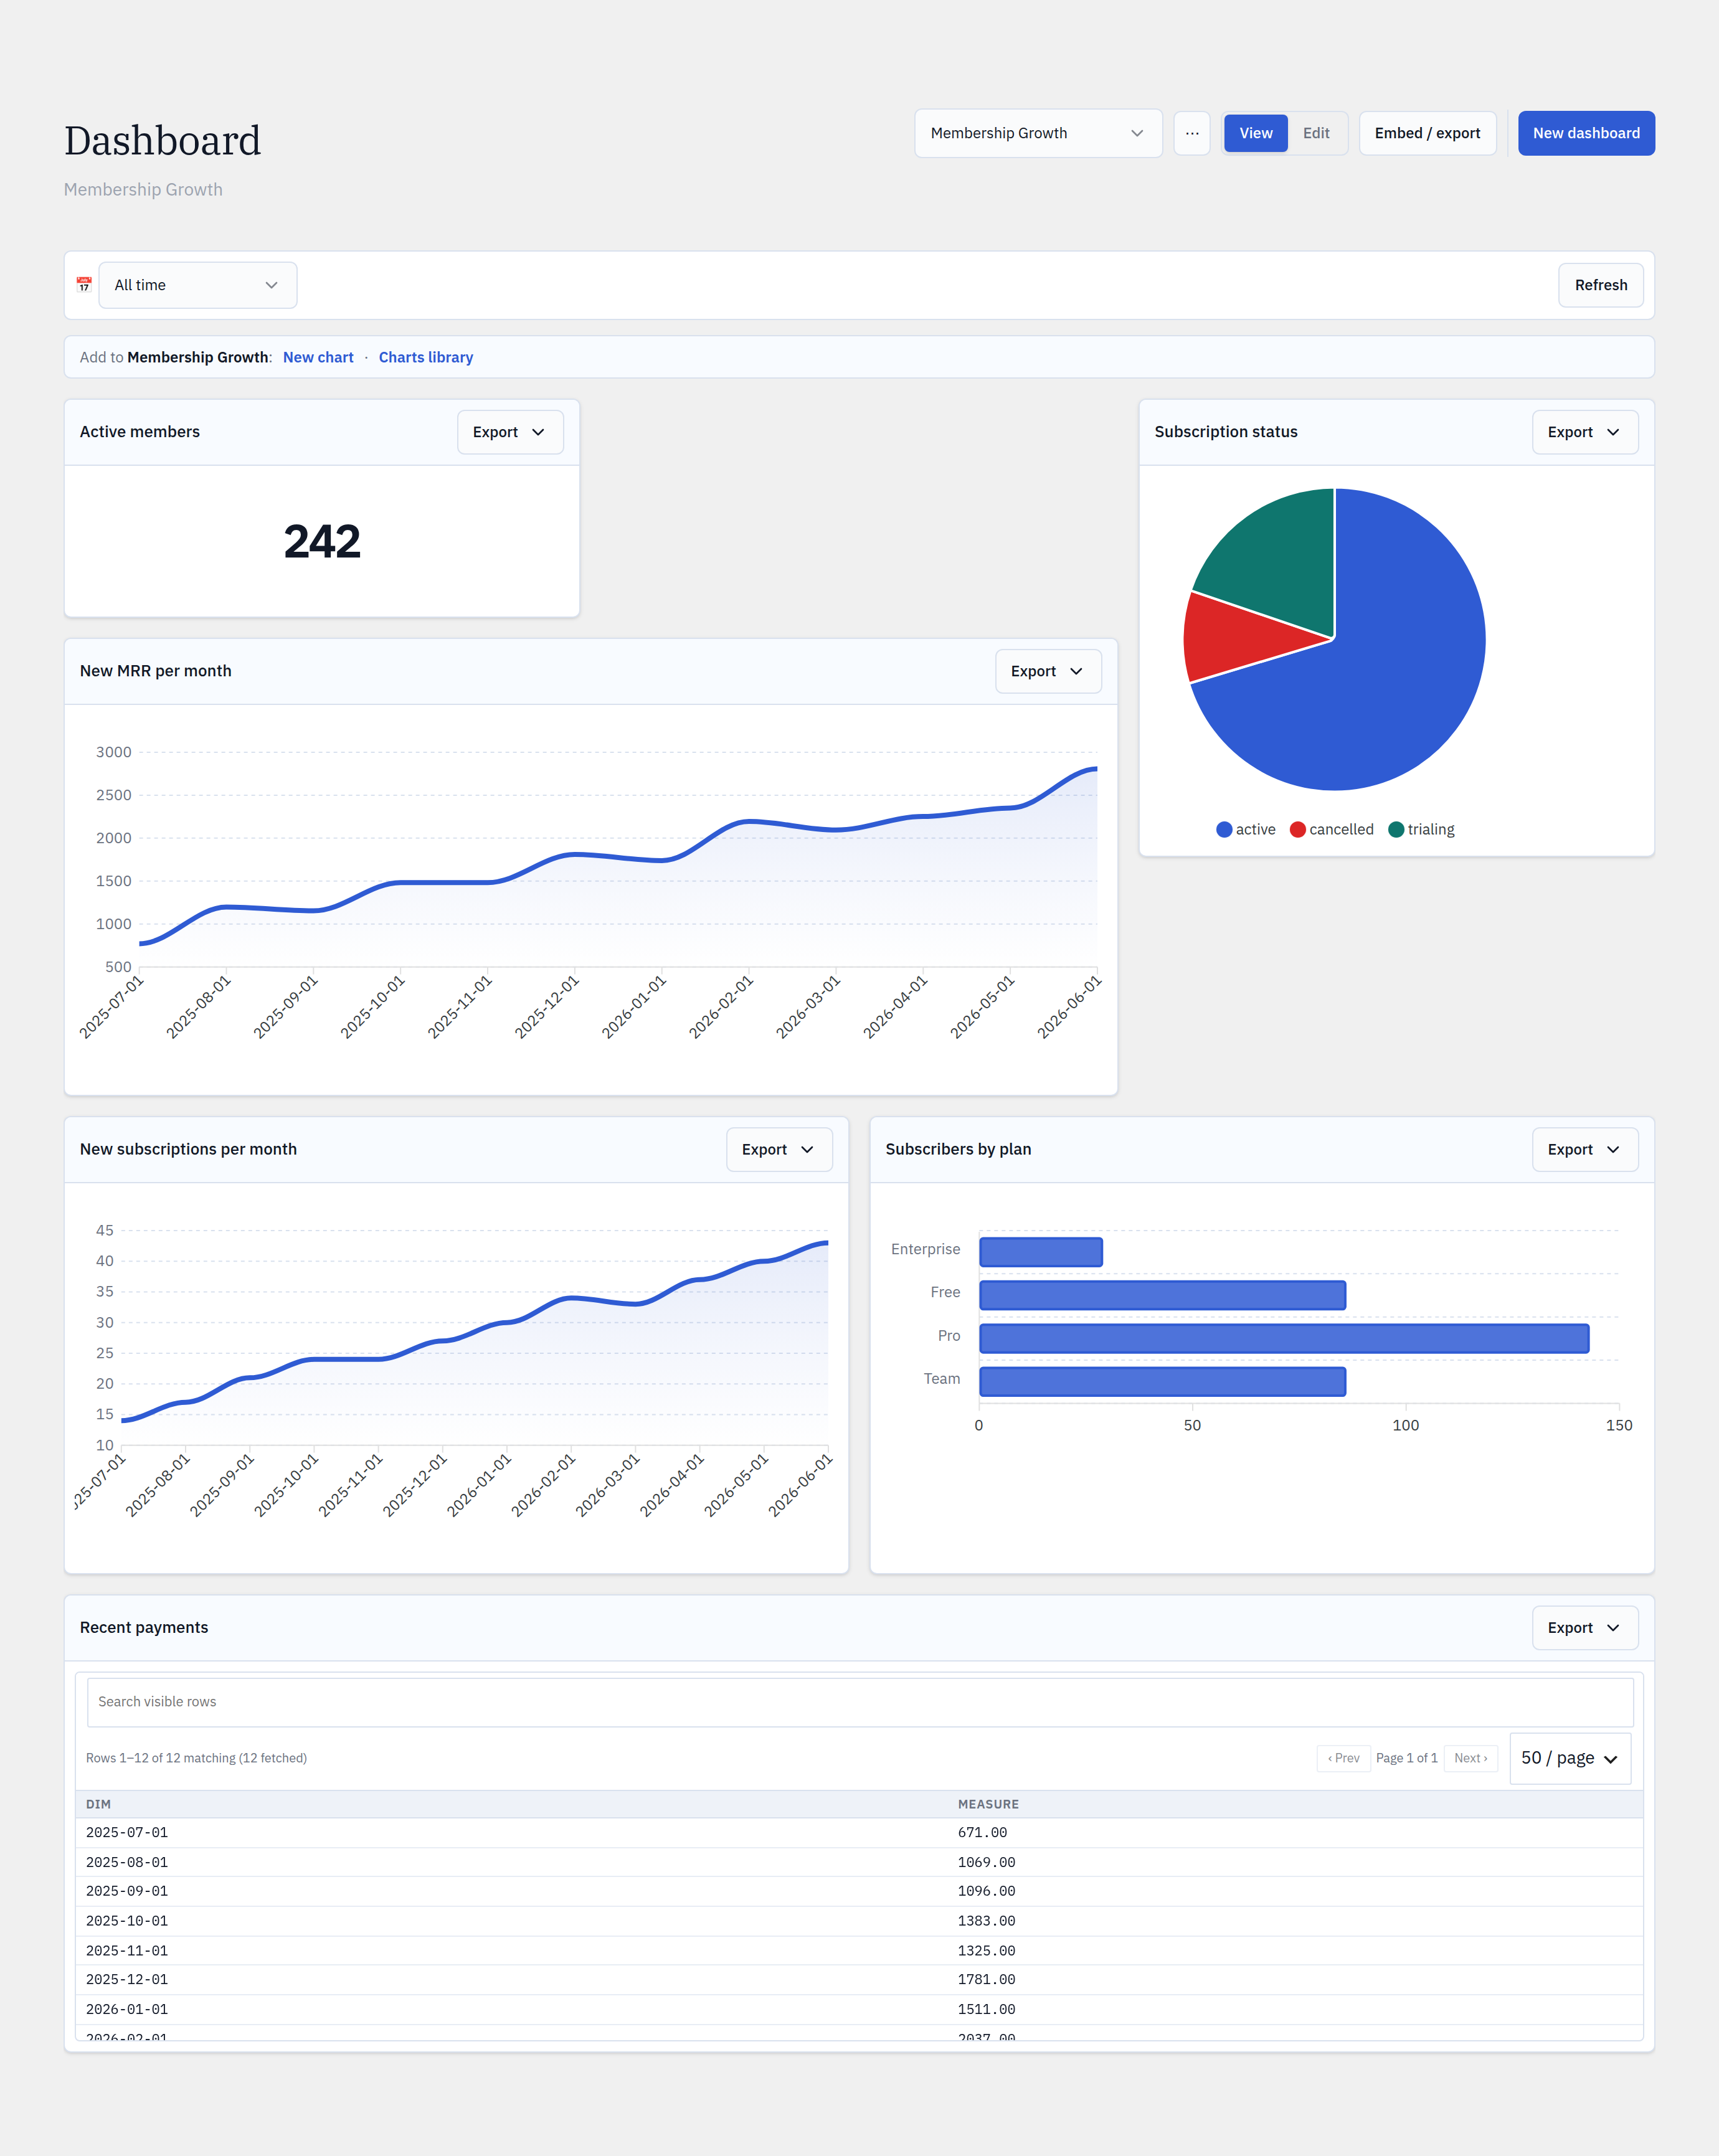
Actual Glimpse BI dashboards on representative store and subscription data — not illustrations.
E-commerce · store analytics
Revenue, completed orders, average order value, order-status mix, and revenue by category — straight from your store’s order tables.
Memberships · growth
MRR, new subscriptions, plan mix, active members, and recent payments — the SaaS metrics your subscription plugin already records.
Live across verticals
One engine, every WordPress business.
The same builder, dashboards, and embeds — re-pointed at whatever your stack records.
Every WordPress stack
If a plugin writes it to your database, you can chart it.
No native integrations to configure — Glimpse BI reads the tables these popular plugins already create.
Blogs & publishers
Track publishing cadence, top categories and tags, author leaderboards, and your most engaged commenters — the questions an editor-in-chief actually asks, straight from WordPress core.
WooCommerce & e-commerce
Revenue by product, author, or period; average order value; refunds and coupon usage. Join orders against posts and users without exposing your database to an external BI tool.
Memberships & subscriptions
Signups week over week, active vs. lapsed members, MRR trends, and churn — composed straight from the tables your membership plugin already writes.
Courses & LMS
Enrollments, course completion rates, quiz pass rates, and most-active learners — turn your learning platform’s tables into an at-a-glance instructor dashboard.
Bookings & appointments
Appointments per day, no-show rates, busiest staff and services, revenue per slot. The same engine behind the one-click KiviCare clinic dashboard works for any scheduler.
Events & ticketing
Tickets sold per event, attendance over time, top-selling sessions, and capacity utilization — built from the tables your events plugin populates.
Forms & lead generation
Submissions per form, conversion trends, and source breakdowns. Chart the entries your forms plugin stores to see which campaigns actually fill the pipeline.
Donations & nonprofits
Total raised by campaign, recurring vs. one-time gifts, average donation, and donor retention — a board-ready fundraising dashboard from your donation tables.
Agencies
Build dashboards once, white-label the embeds, and resell to clients across unlimited sites with Editor-role delegation — one toolkit for every vertical above.
Don’t see your plugin? If it stores data in a WordPress table, Glimpse BI can chart it.
Your vertical, your tables, your dashboard.
Start with the free plugin. Build the charts your team actually asks for.